
February 2026
In ReefCloud, the region around the image points (we call this a patch) is characterised by a backend model as a feature vector. These feature vectors are then used in combination with the users’ manual annotations to train each project’s classifier model. This is an integral part of the ReefCloud machinery that users do not interact with, except by choosing the number of points on each image, which determines which image patches are used.
At AIMS, the Data and Digital Engineering team have identified that the packages/environments used in the feature vector extraction process have reached - or are about to reach - end of life. As such they have updated the pipeline resulting in the necessary security updates as well as some performance improvements.
However, the changes have resulted in a change in the outputs of the feature vector extractor model. In this report we will train models using combinations of the outputs of the existing and updated pipelines and compare the results to help us plan the rollout of the new pipeline and required communications with users.
The data used in this analysis has been taken from the AIMS LTMP ReefCloud project. DDE team have extracted the human classified points, and regenerated the feature vectors using the updated pipeline. We will use data from 2023 and 2025 in order to analyse the performance and to simulate the rollout of the new pipeline.
We will perform three tests to compare the performance of the models trained on the different feature vector outputs. Each test will include a baseline performance estimate using vectors from the existing pipeline to both train and test the models.
| Model | Train data | Test Data |
|---|---|---|
| 1a | Random 80% of all data (old vectors) | Remaining 20% of all data (old vectors) |
| 1b | Random 80% of all data (new vectors) | Remaining 20% of all data (new vectors) |
| 1c | Random 80% of all data (old vectors) | Remaining 20% of all data (new vectors) |
| 2a | Year 1 data (old vectors) | Year 2 data (old vectors) |
| 2b | Year 1 data (new vectors) | Year 2 data (new vectors) |
| 2c | Year 1 data (old vectors) | Year 2 data (new vectors) |
| 3a | Year 1 data (old vectors) + 30% Year 2 (old vectors) | Remaining 70% Year 2 (old vectors) |
| 3b | Year 1 data (old vectors) + 30% Year 2 (old vectors) | Remaining 70% Year 2 (new vectors) |
| 3c | Year 1 data (old vectors) + 30% Year 2 (new vectors) | Remaining 70% Year 2 (new vectors) |
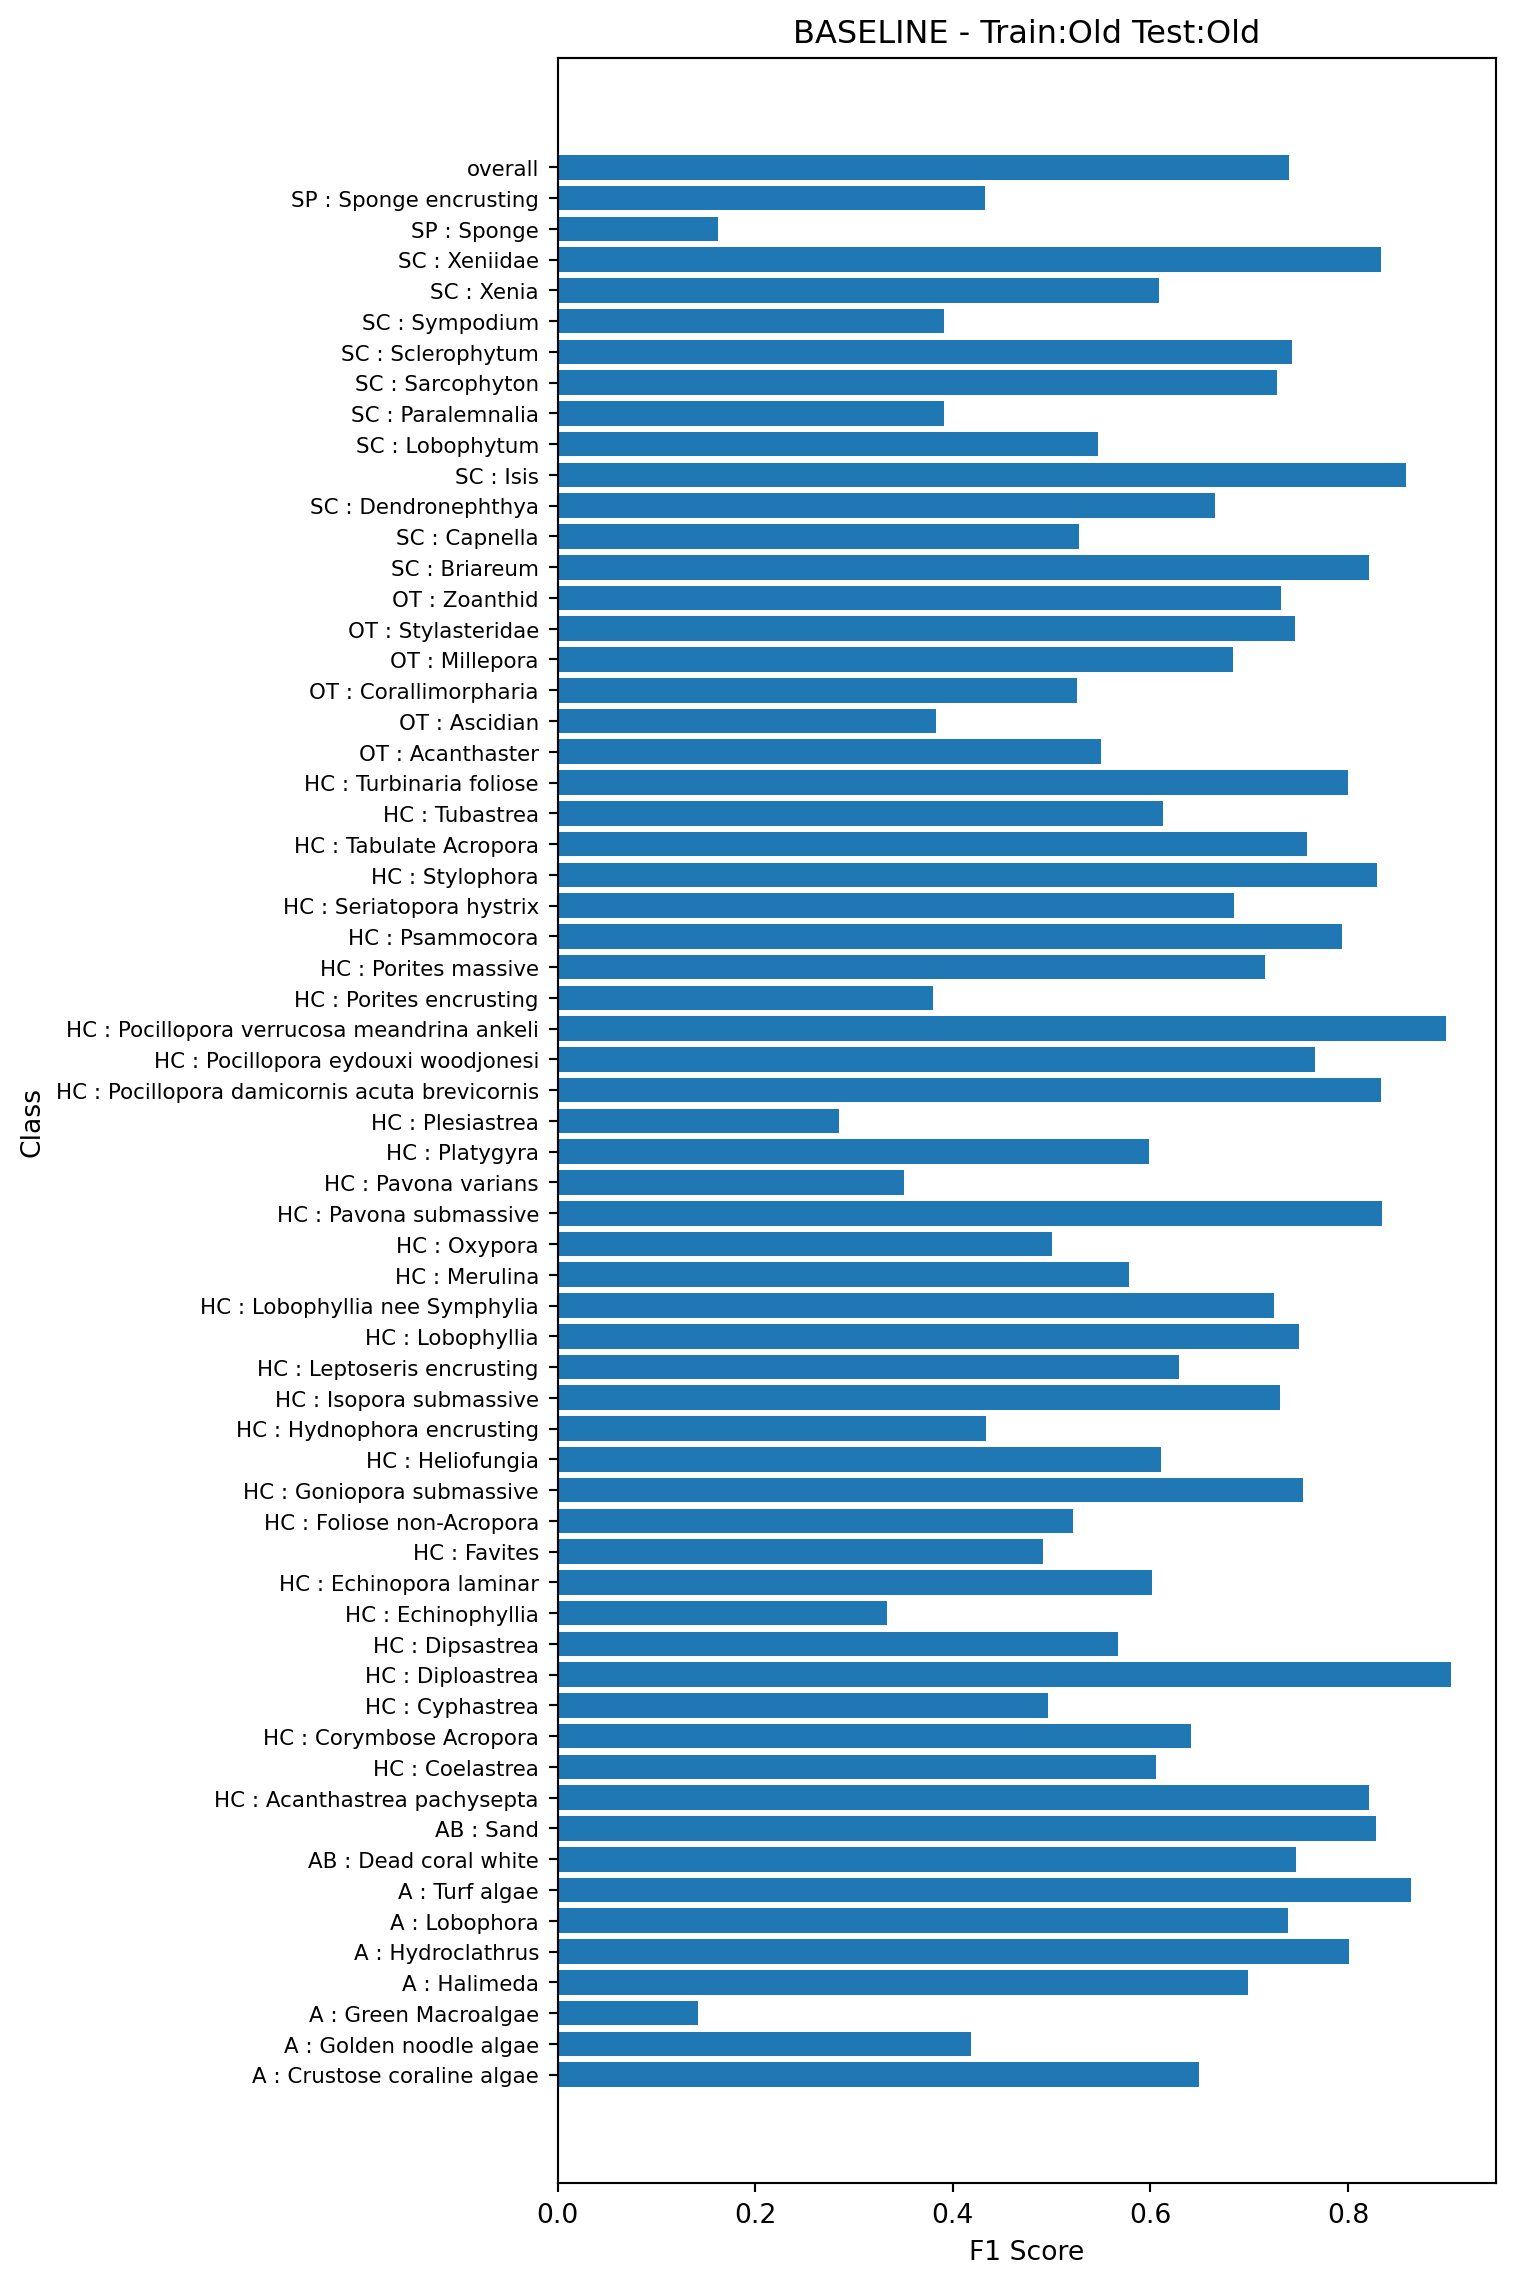
To demonstrate the baseline performance, we’ll first train a model on 80% of the data using the existing feature vectors, and test on the remaining 20% again using the existing feature vectors. This is model 1a in Table 1. Note, in all plots classes containing fewer than 50 examples in the test set are not shown
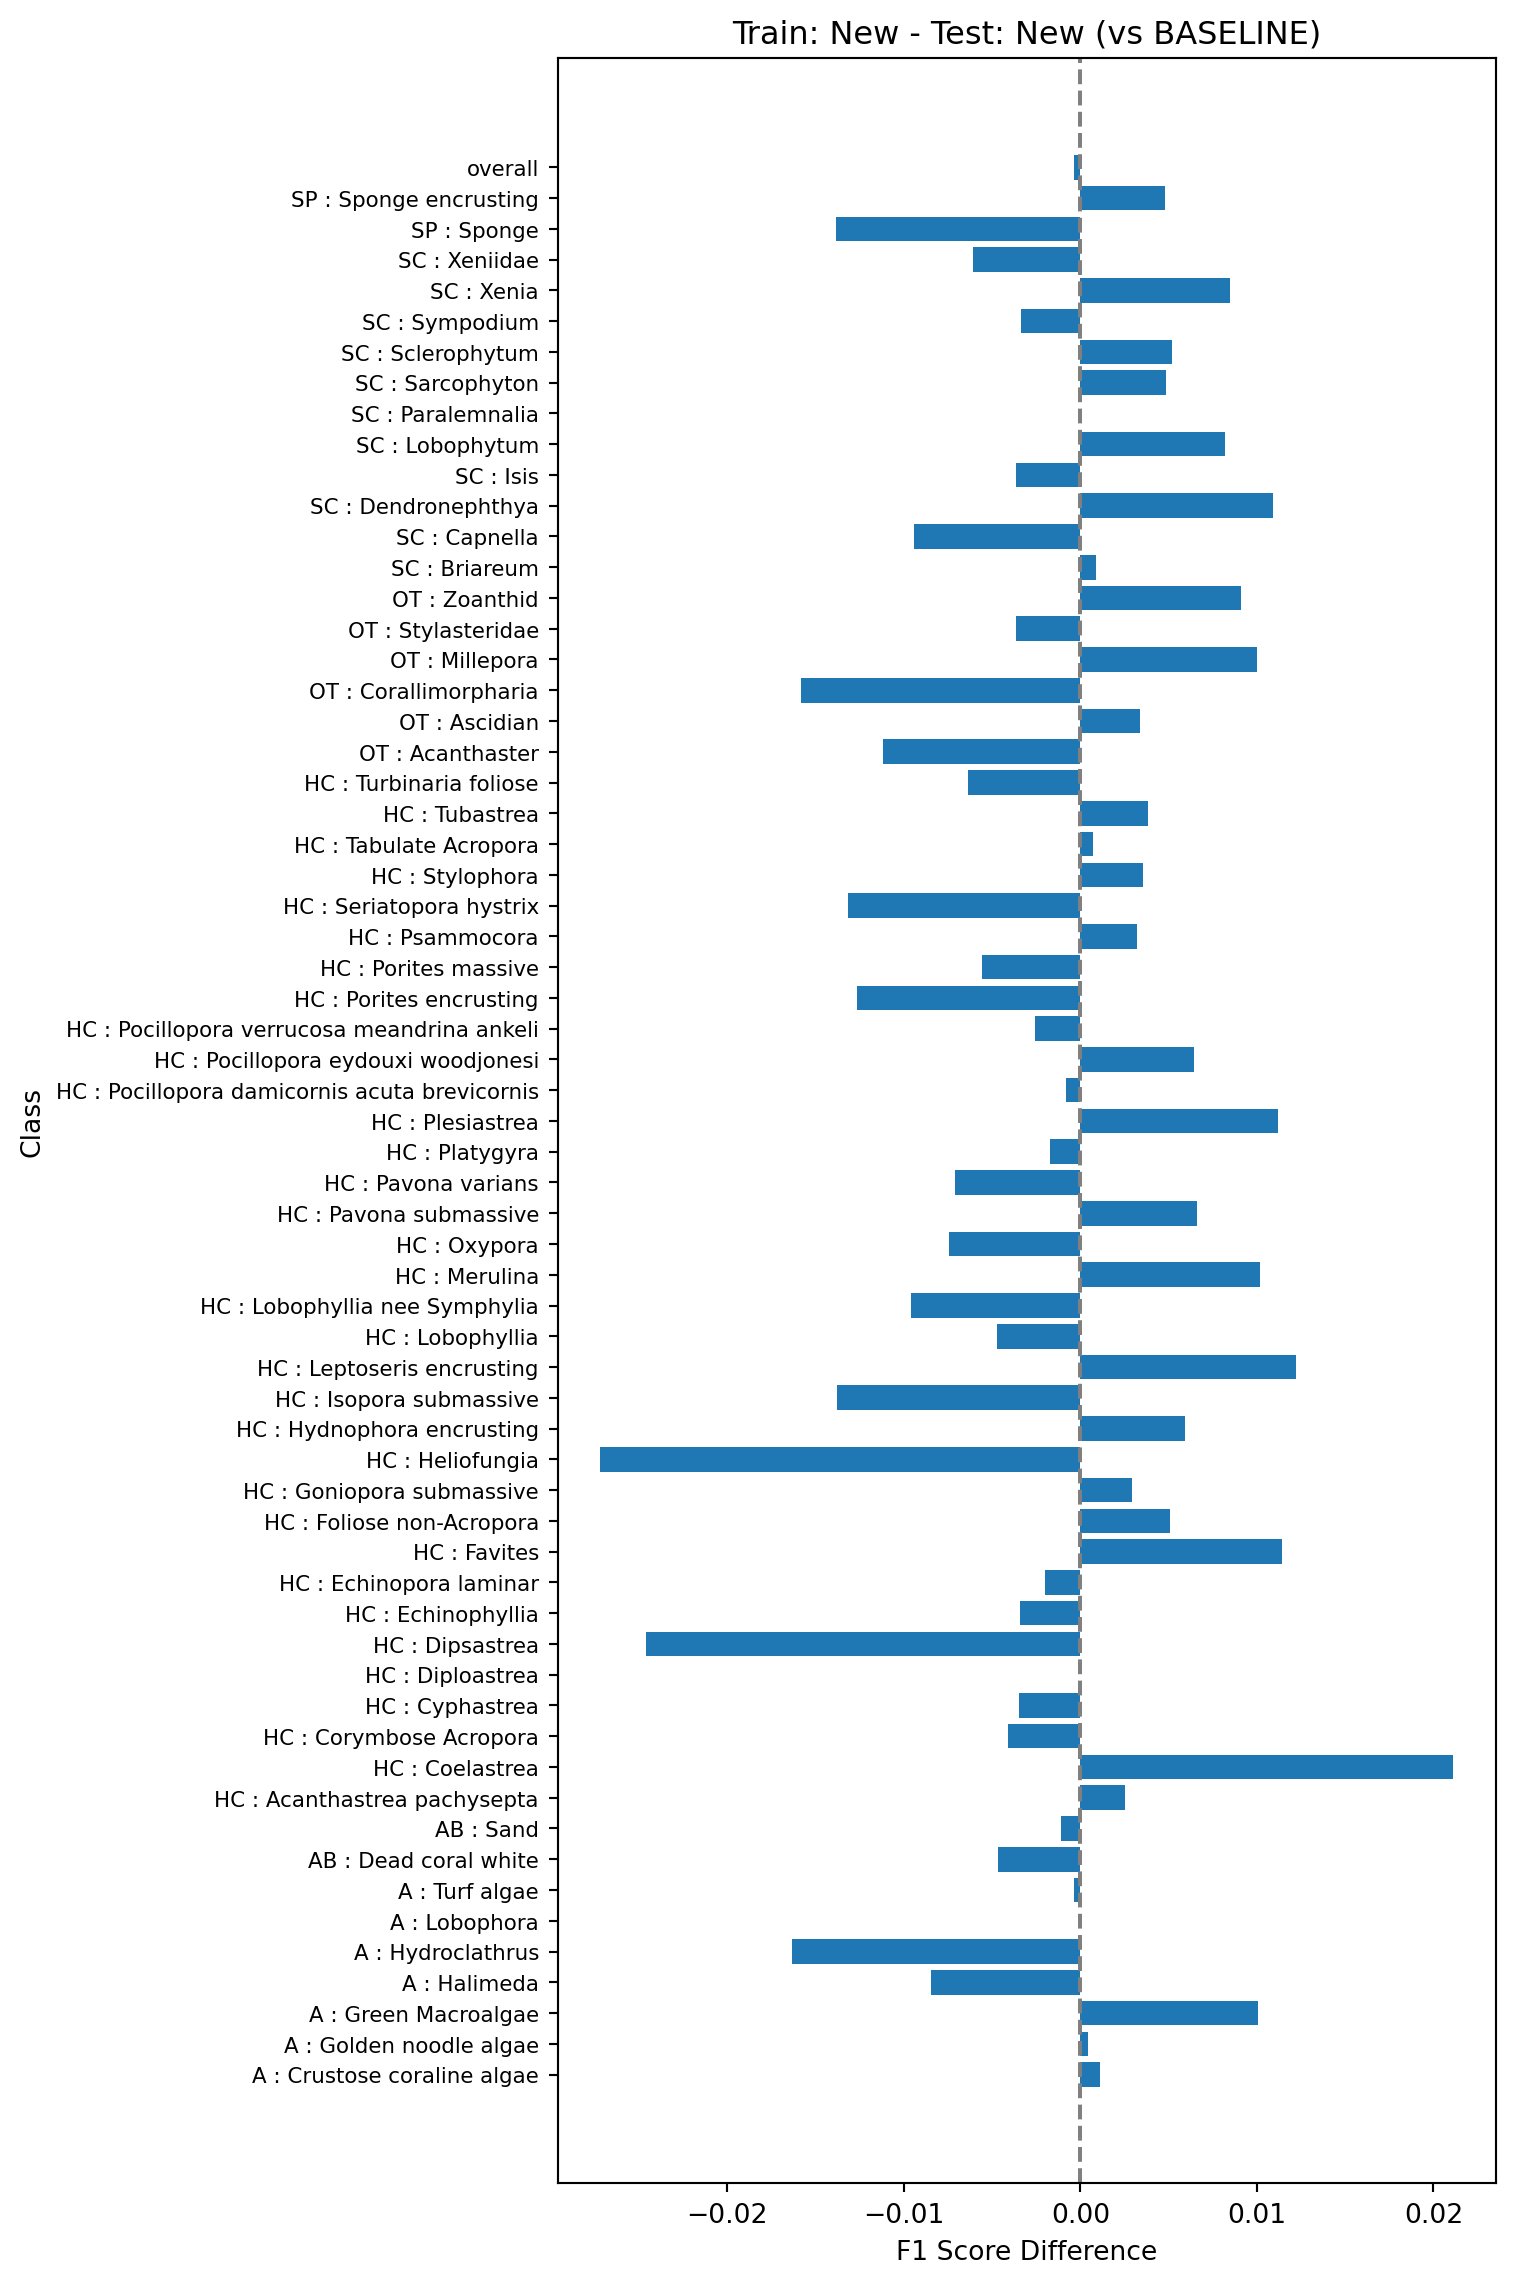
Next, we’ll train a model on the same 80% of the data but using the new feature vectors, and test on the same 20% but also using the new feature vectors. This is model 1b in Table 1. We’ll then compare the F1 scores against those shown in the baseline model (Figure 1). The plot below shows the difference between the F1 scores of this model and the baseline model, where a positive value indicates a higher F1 score and a negative value a lower one.

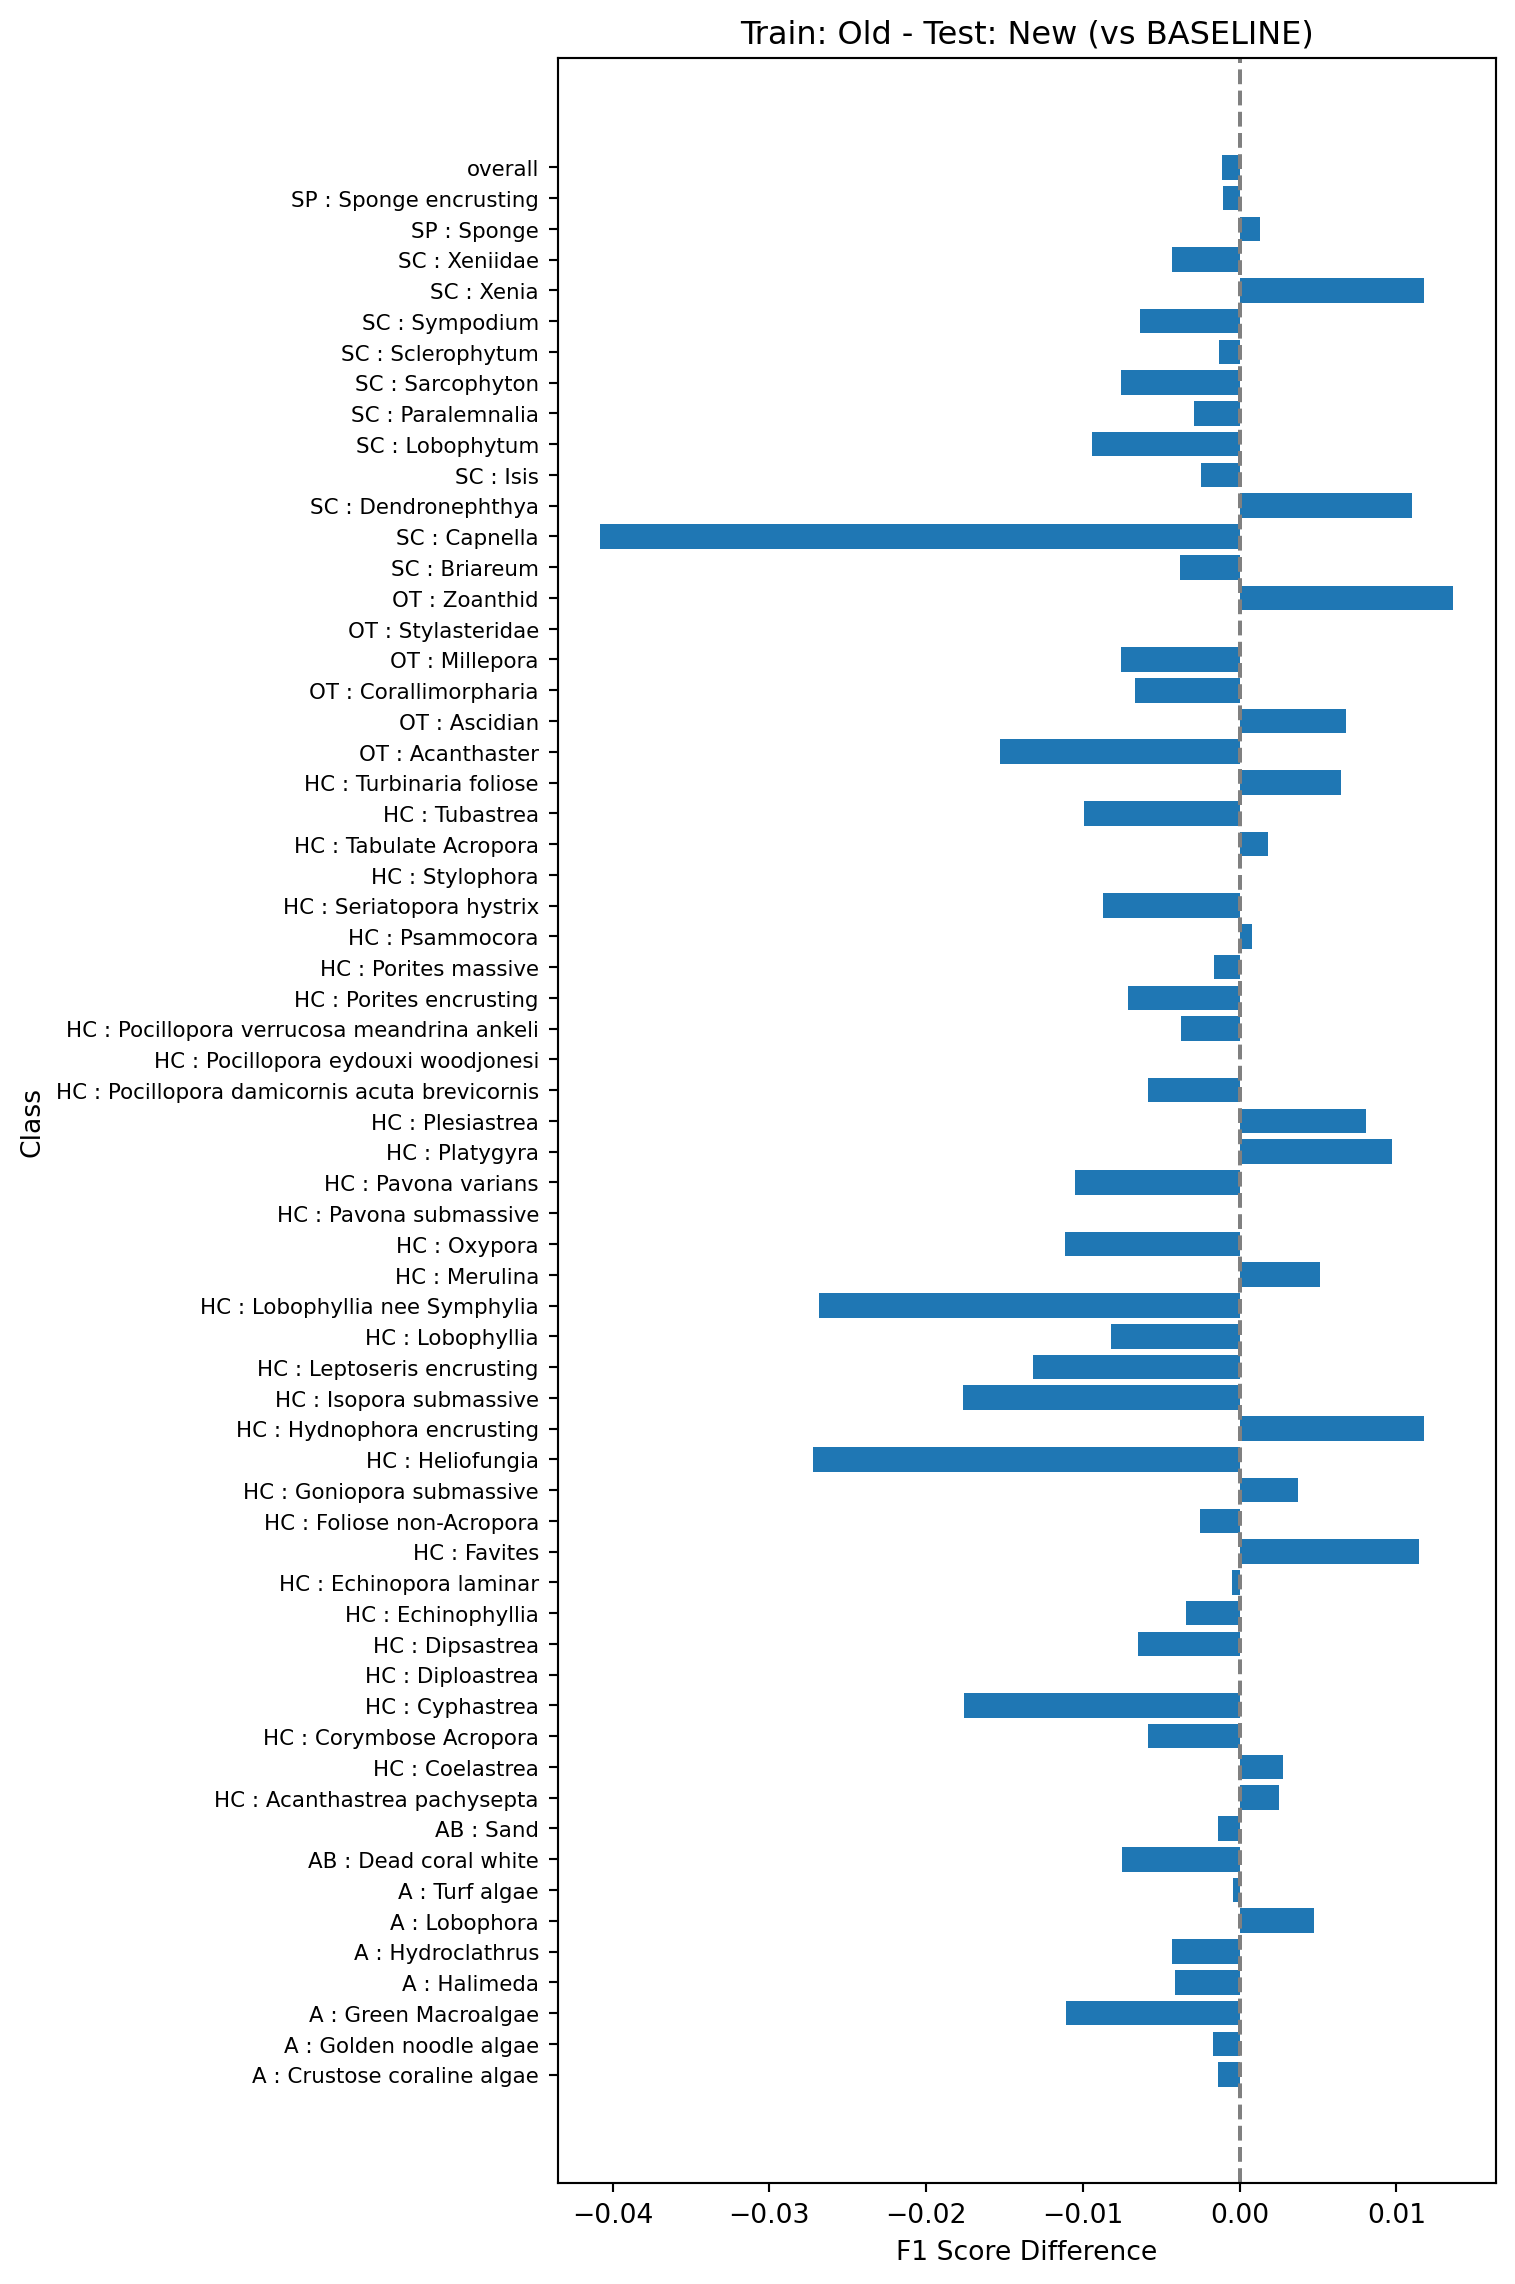
Finally, we’ll check the performance when train on the old vectors and test on the new vectors (model 1c in Table 1). Again, we’ll compare the F1 scores against those shown in the baseline model (Figure 1).

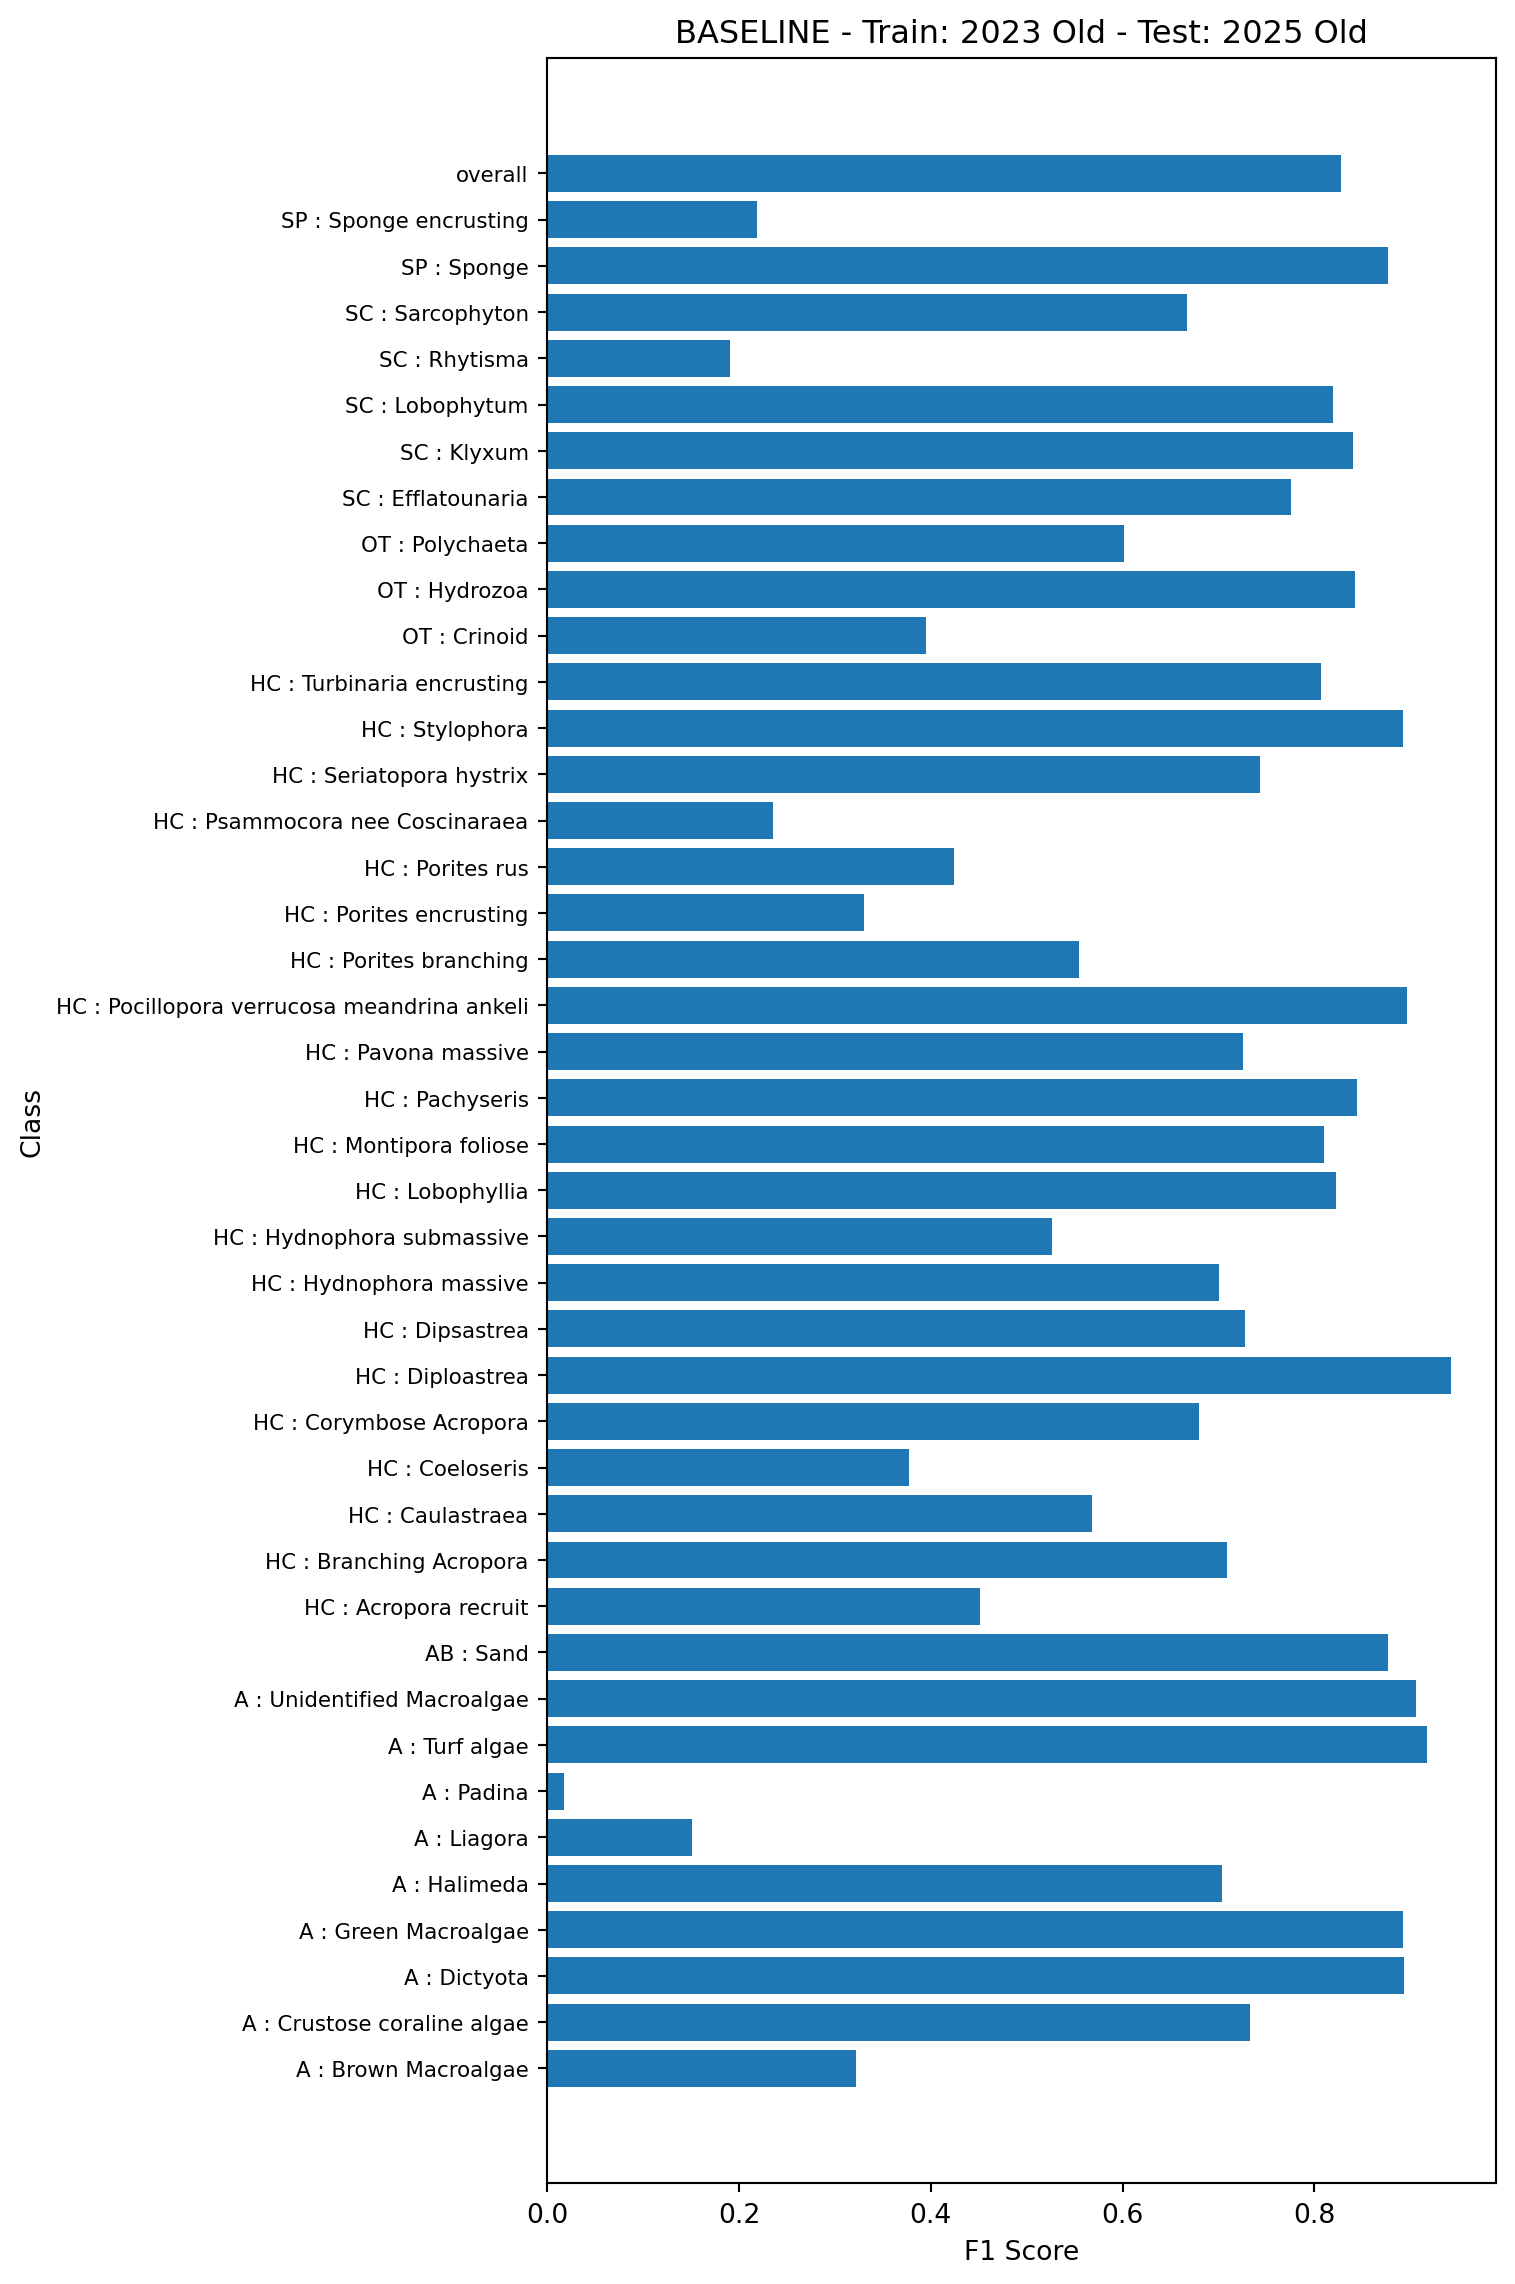
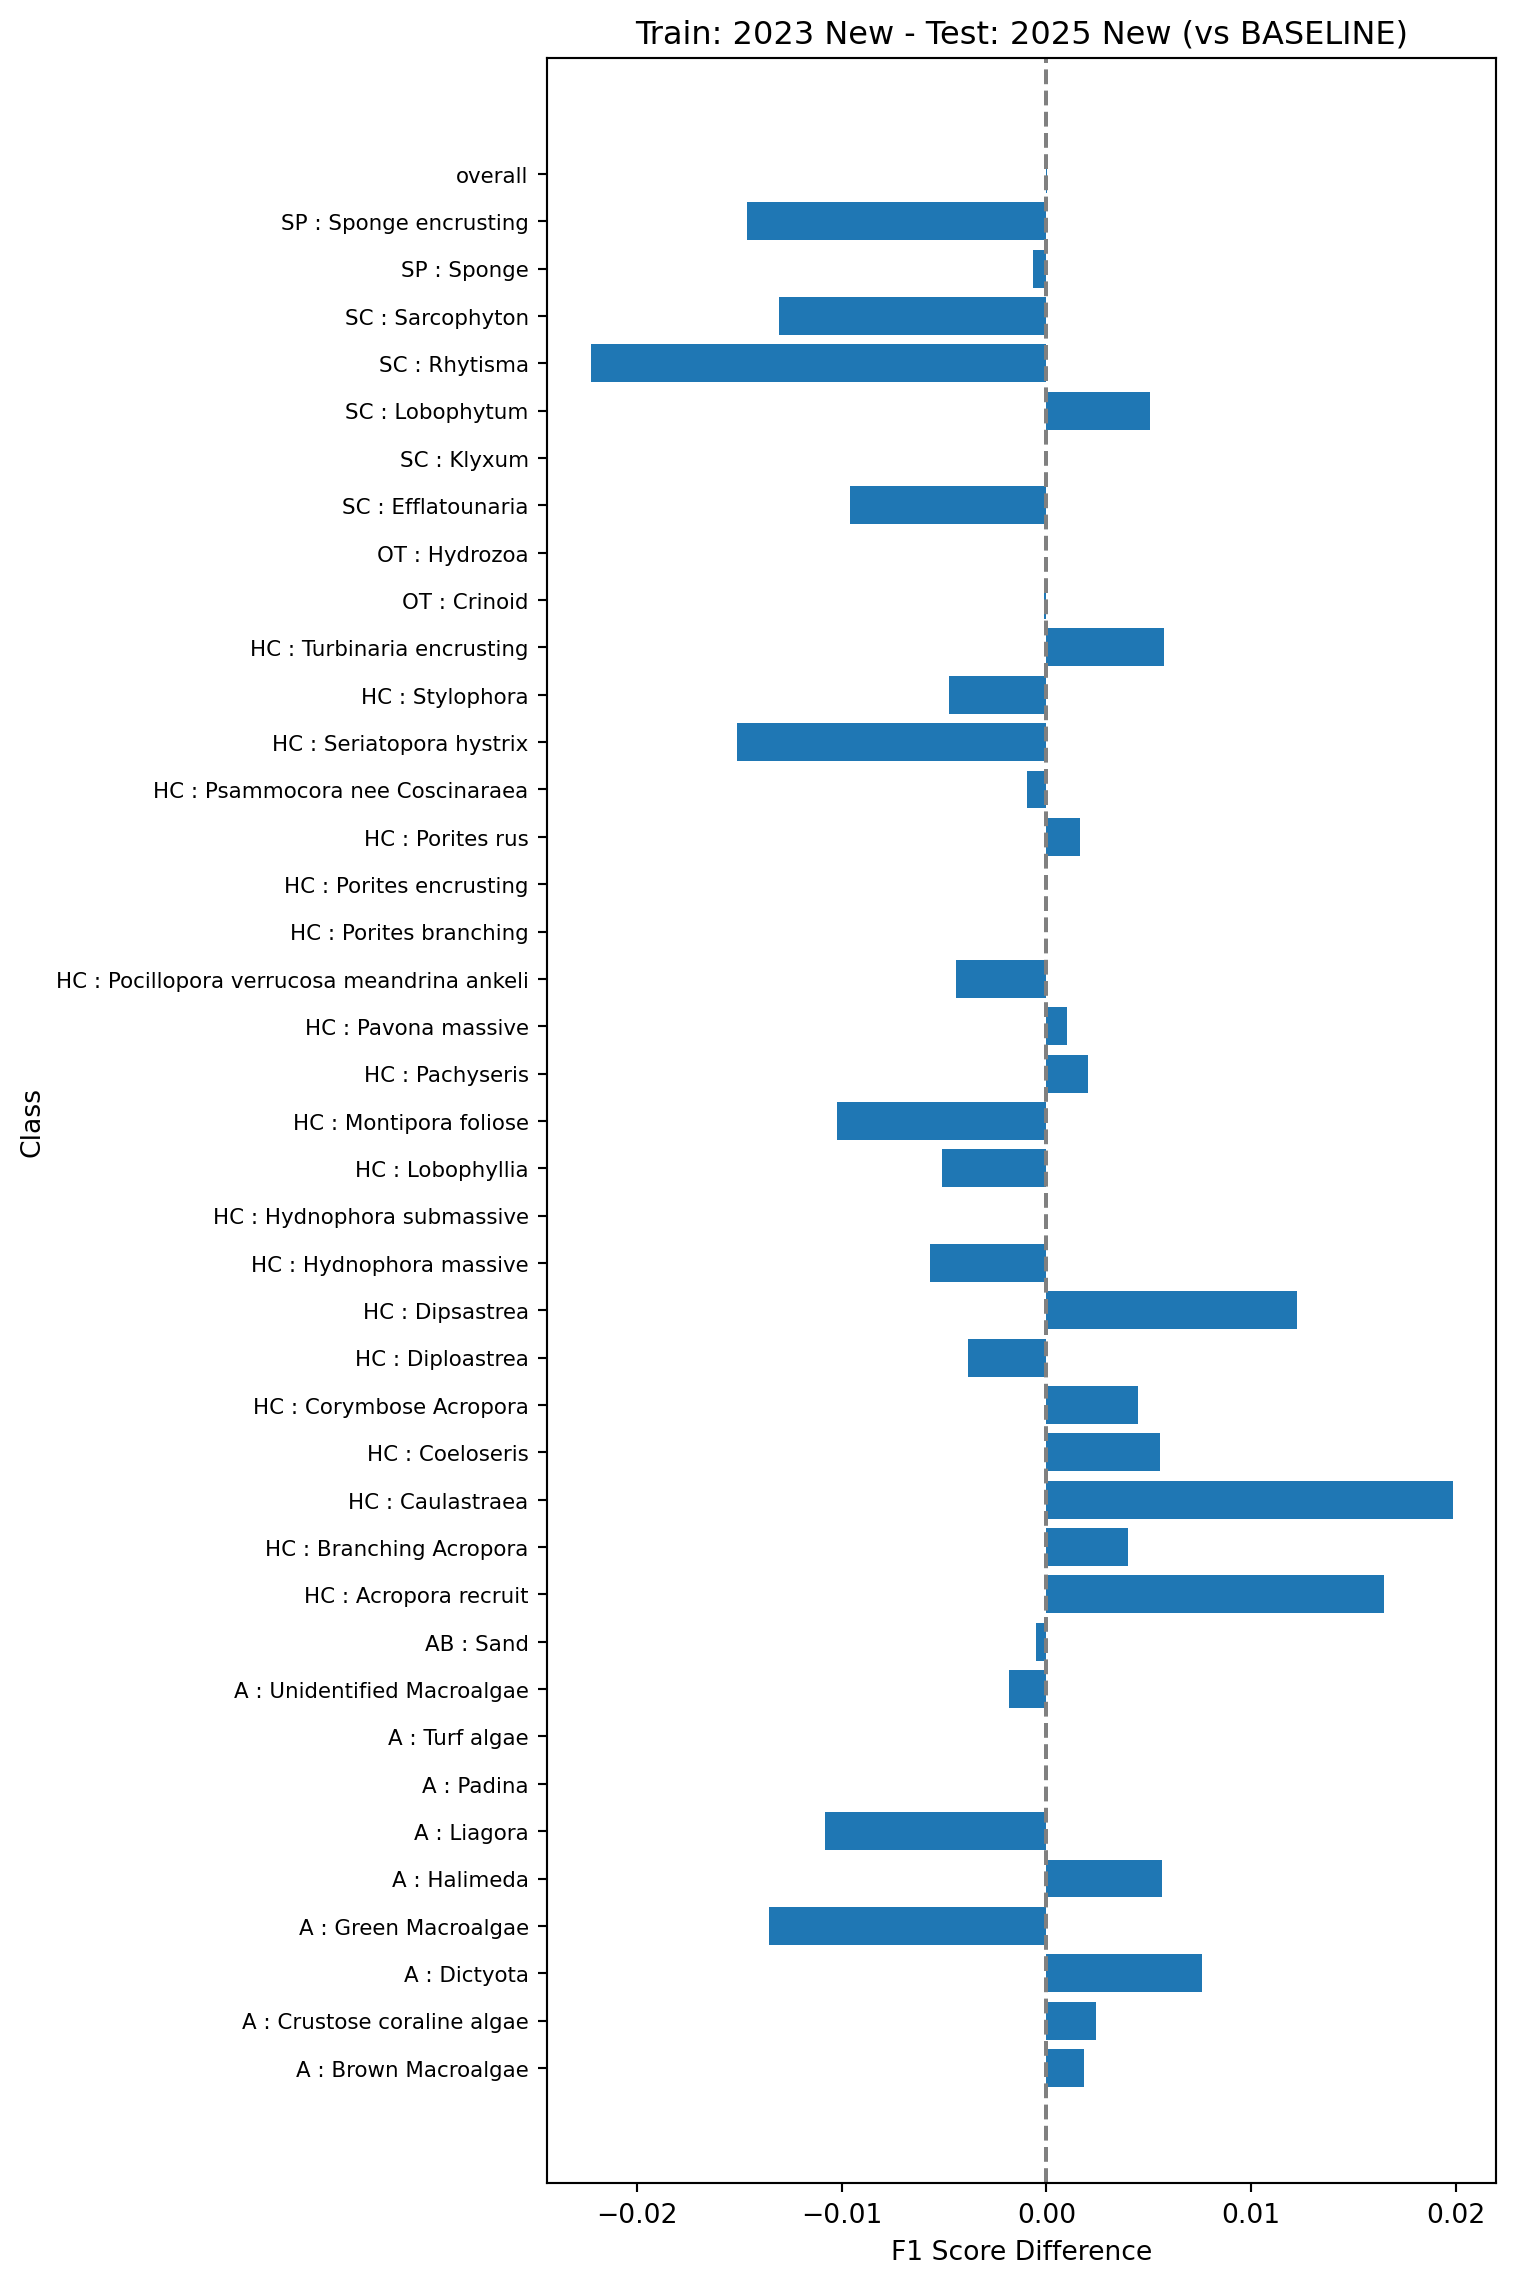
This test will look at performance of models trained on one year of data (here 2023) and tested on the next (2025). The baseline model (model 2a in Table 1) will be trained on the 2023 data using the old vectors and tested on the 2025 data using the old vectors.

Next we’ll compare the baseline model against a model trained on 2023 data and tested on 2025 data but using the new vectors (model 2b in Table 1).

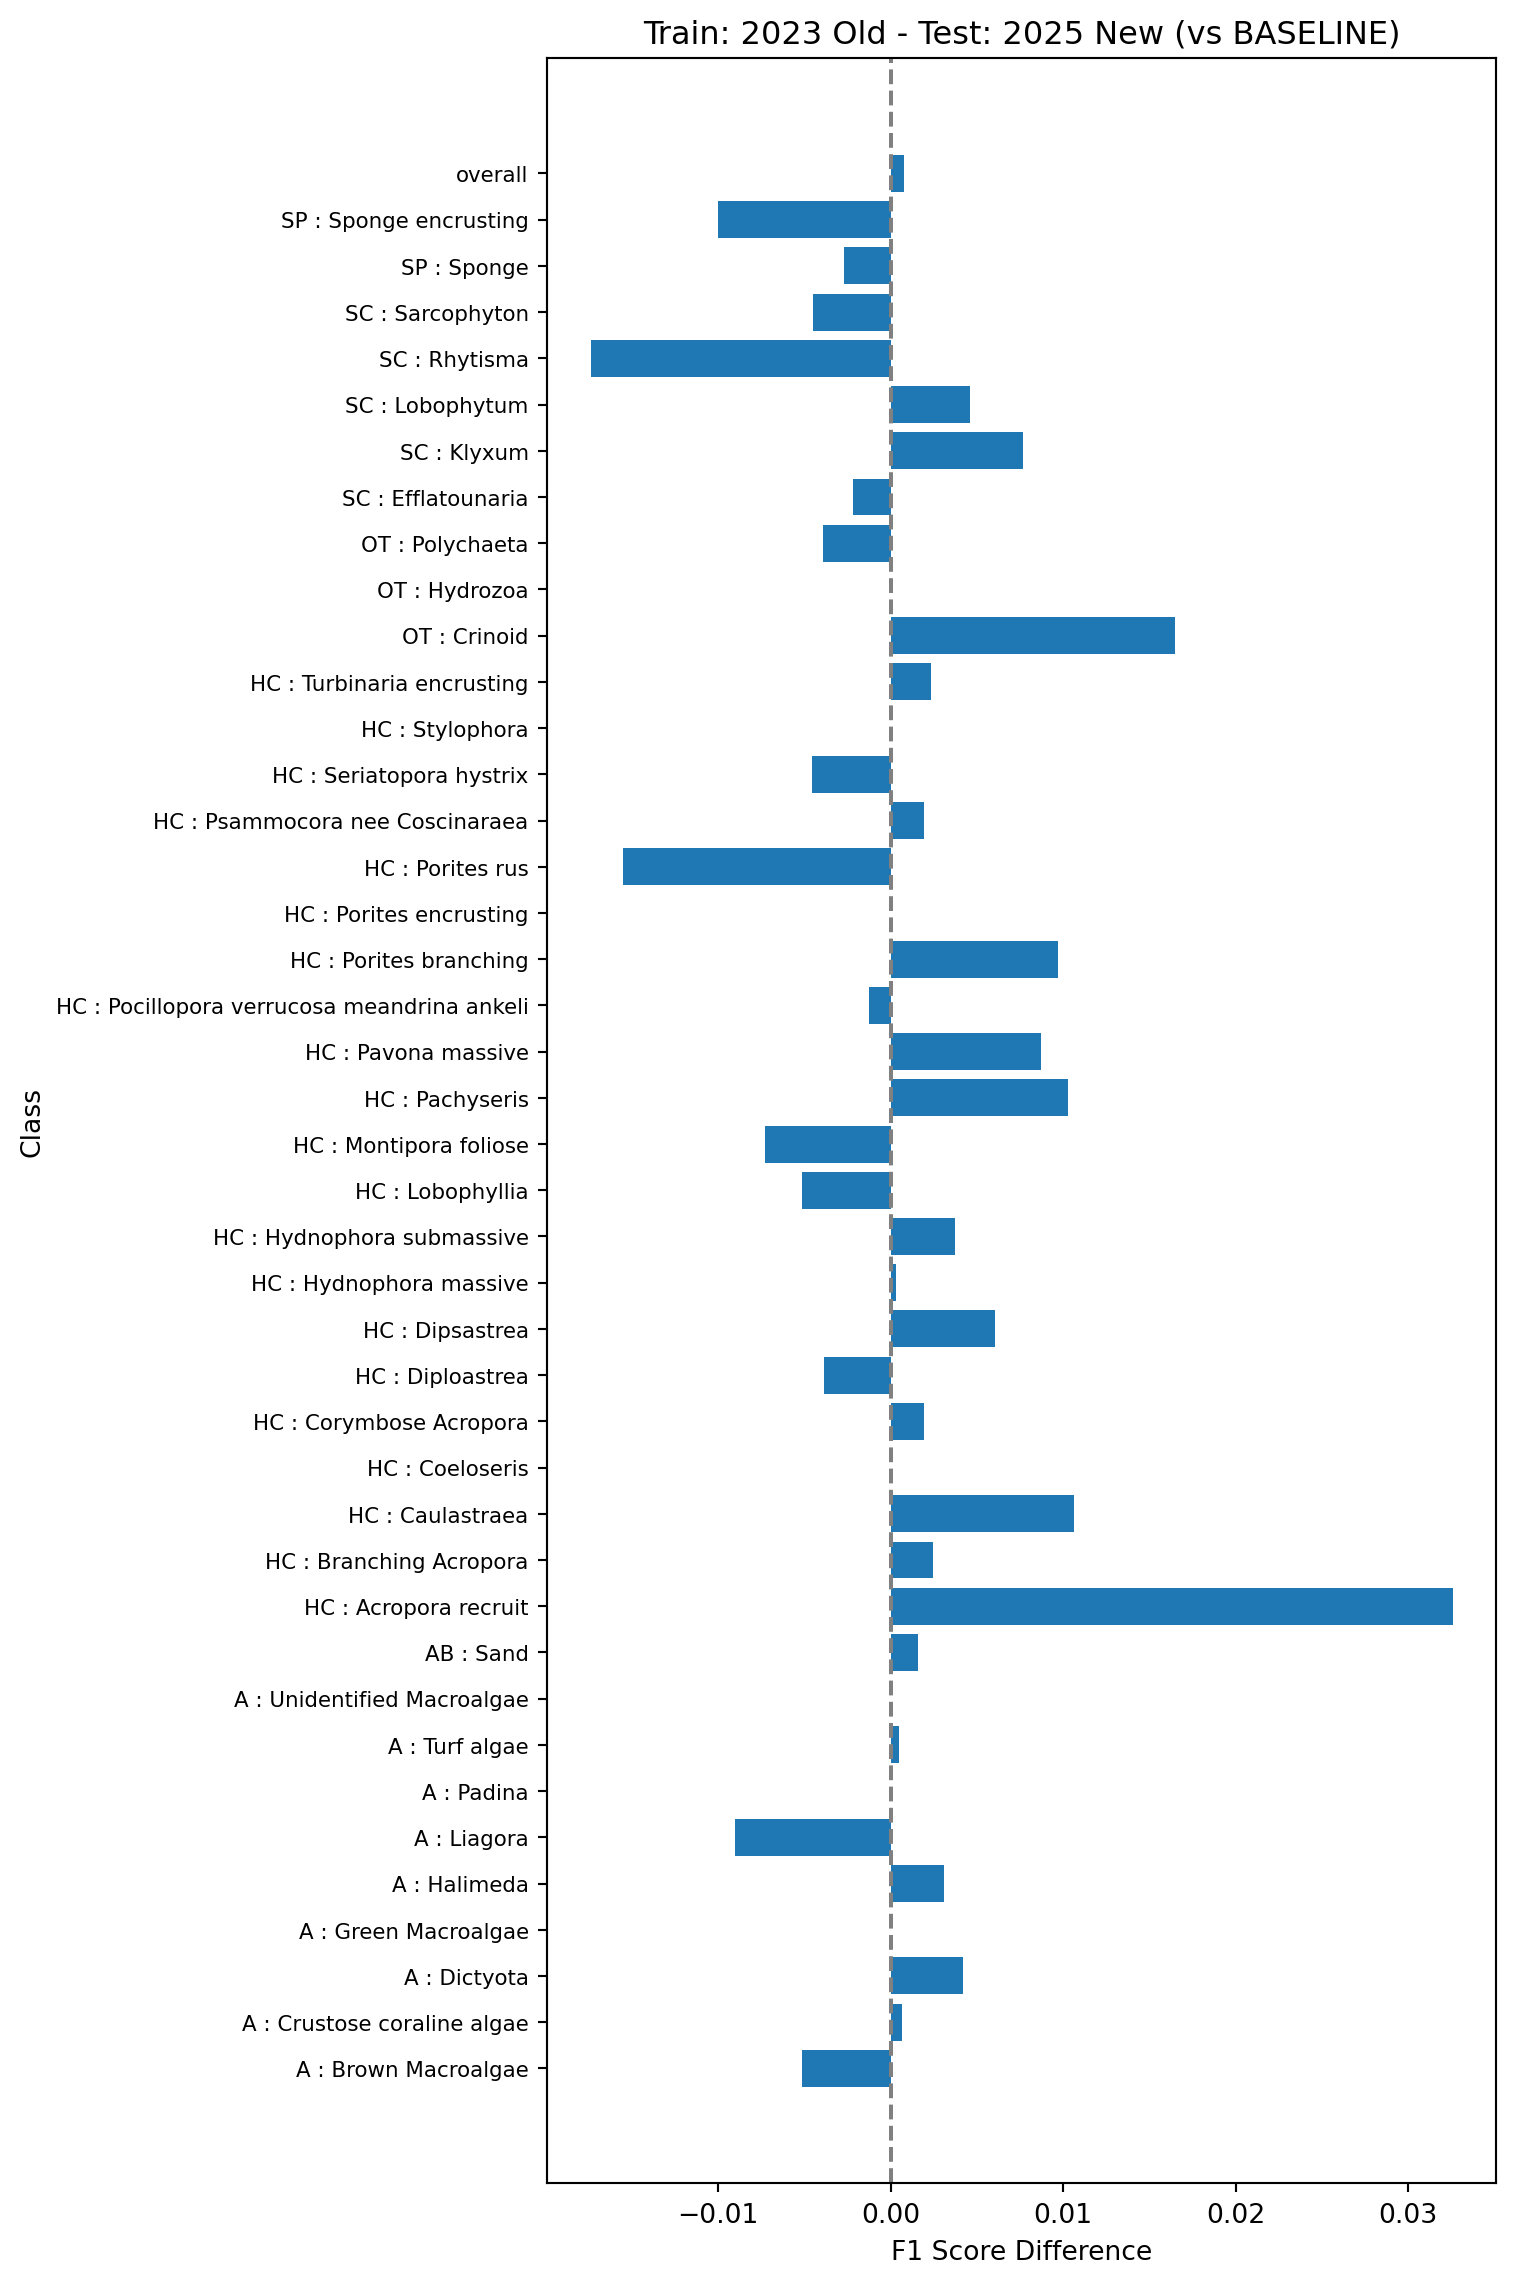
Finally we’ll look at what happens if you train the model on the old vectors using existing data (2023) but test on the new vectors using the new data (2025). This is model 2c in Table 1. This will help simulate updating the pipeline without re-indexing the existing points.

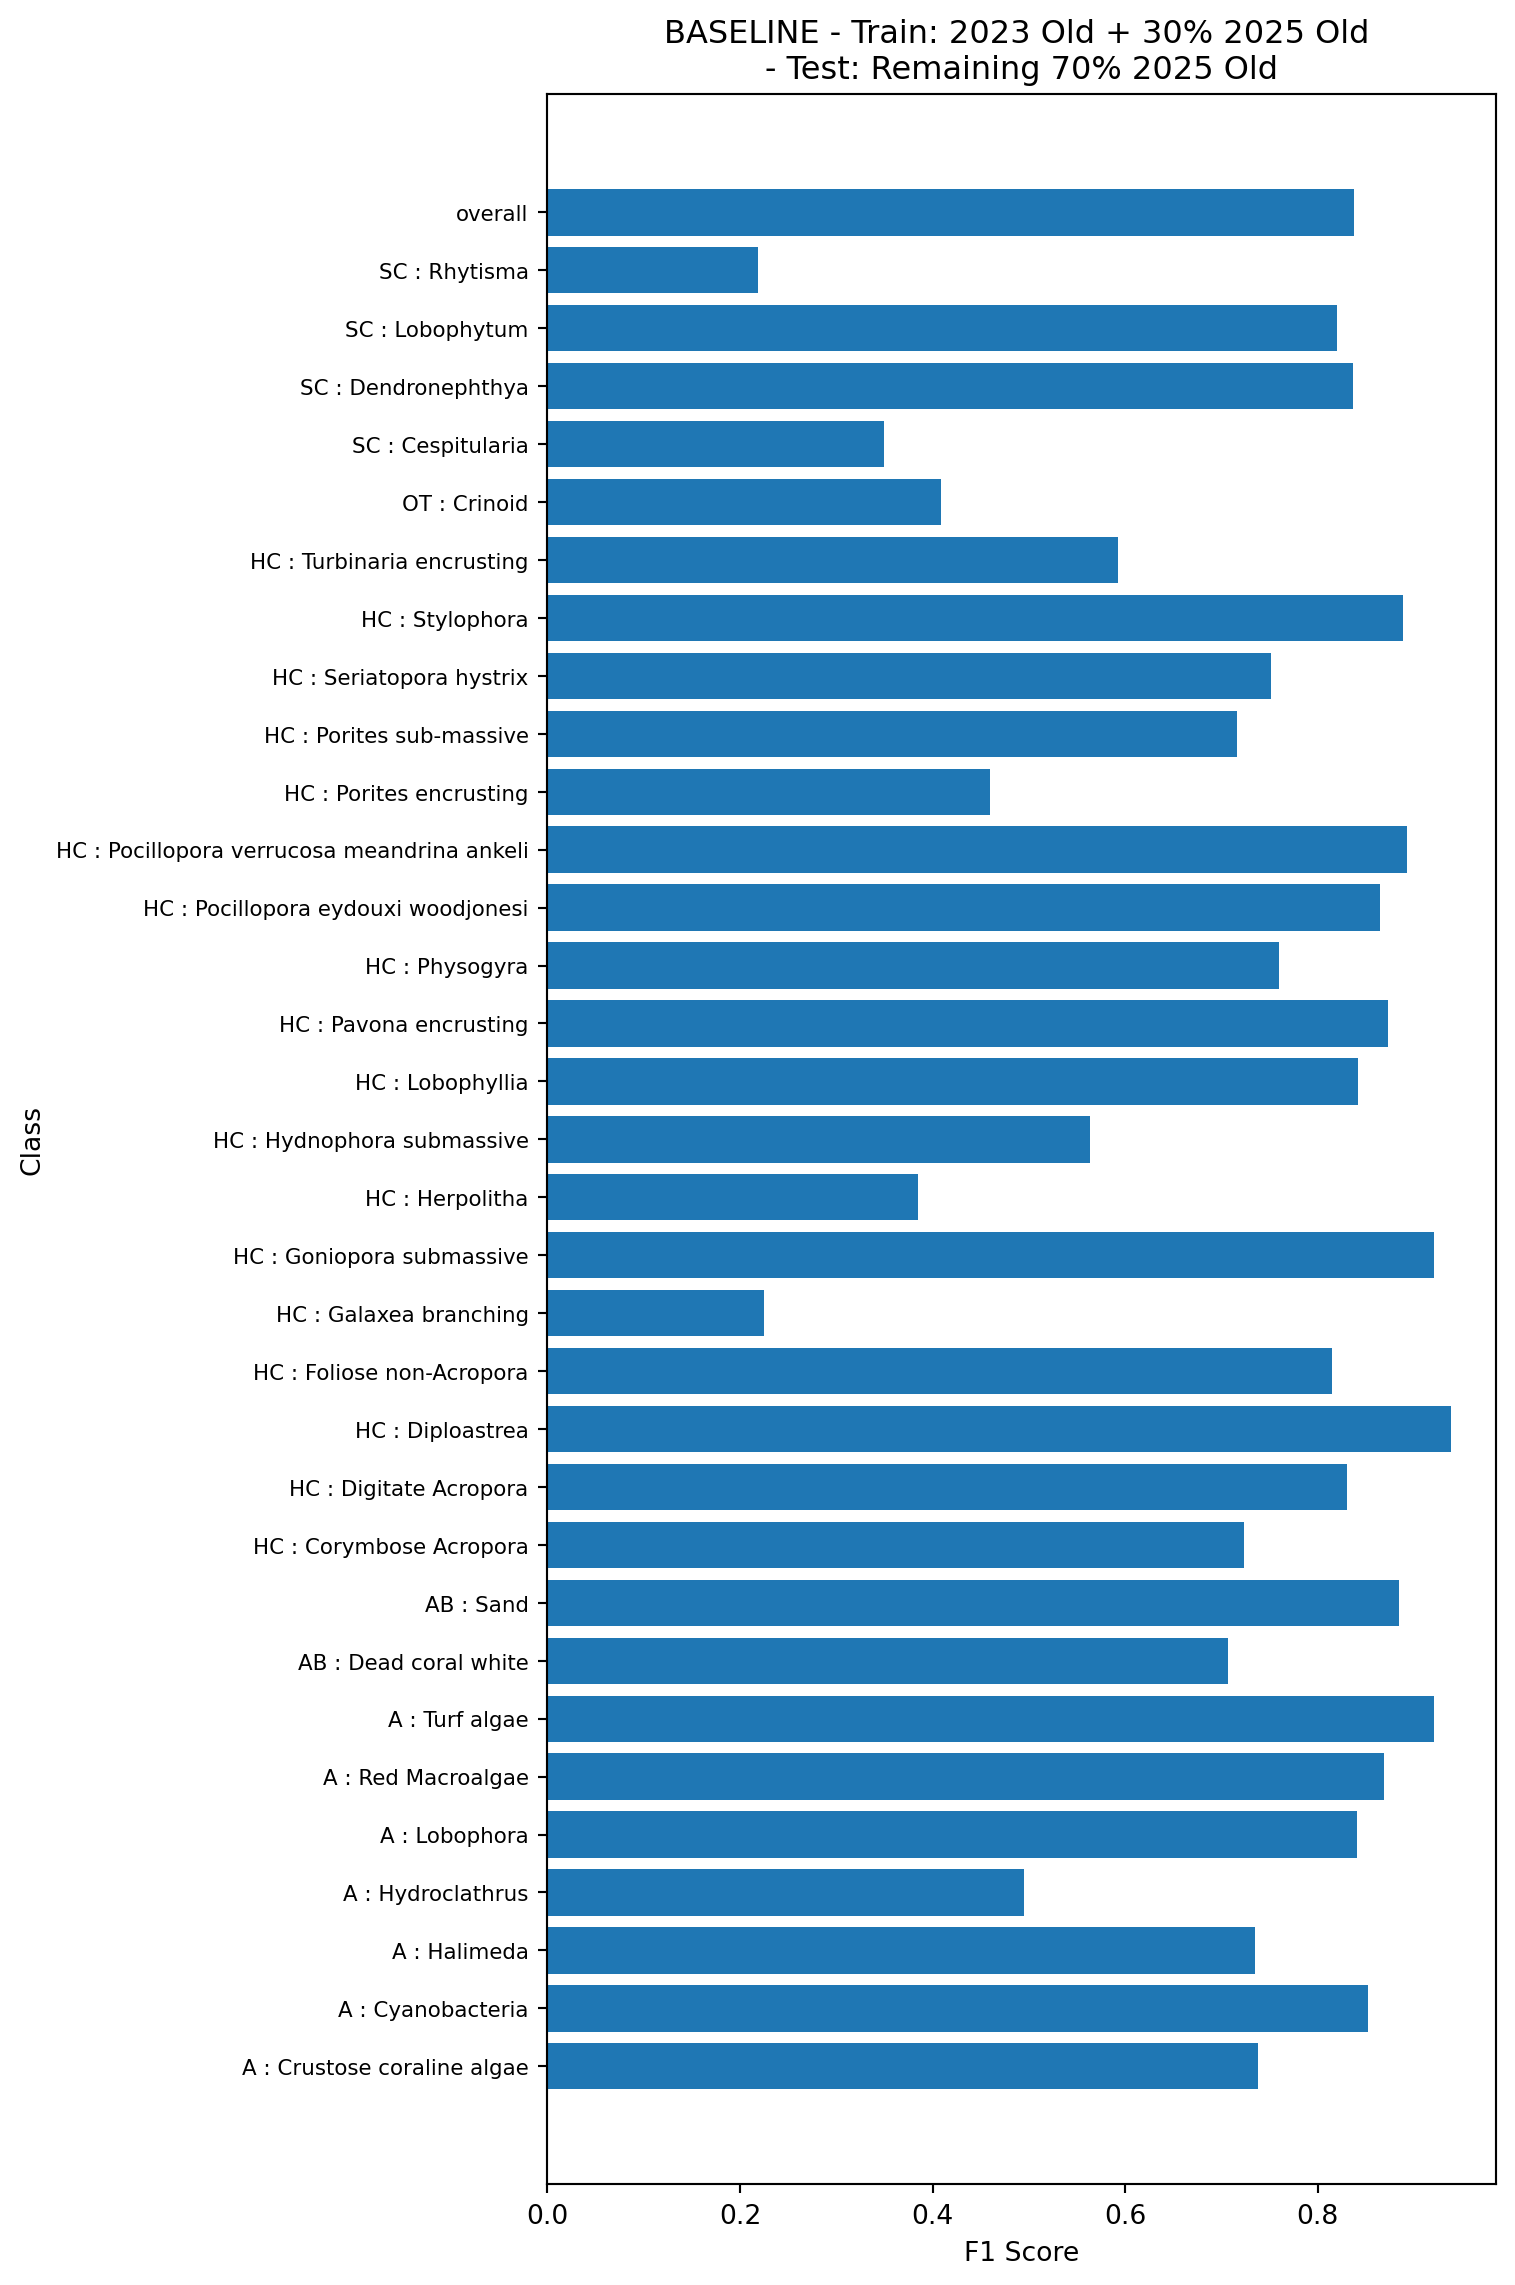
This test will look at what happens when we train models with a combination of old and new vectors. This is more representative of what is likely to happen in practice when we roll out the new pipeline for multi-year projects. The baseline model here is trained using the 2023 data and 30% of the 2025 data, and tested on the remaining 70% of the 2025 data, all using the old vectors (model 3a in Table 1).

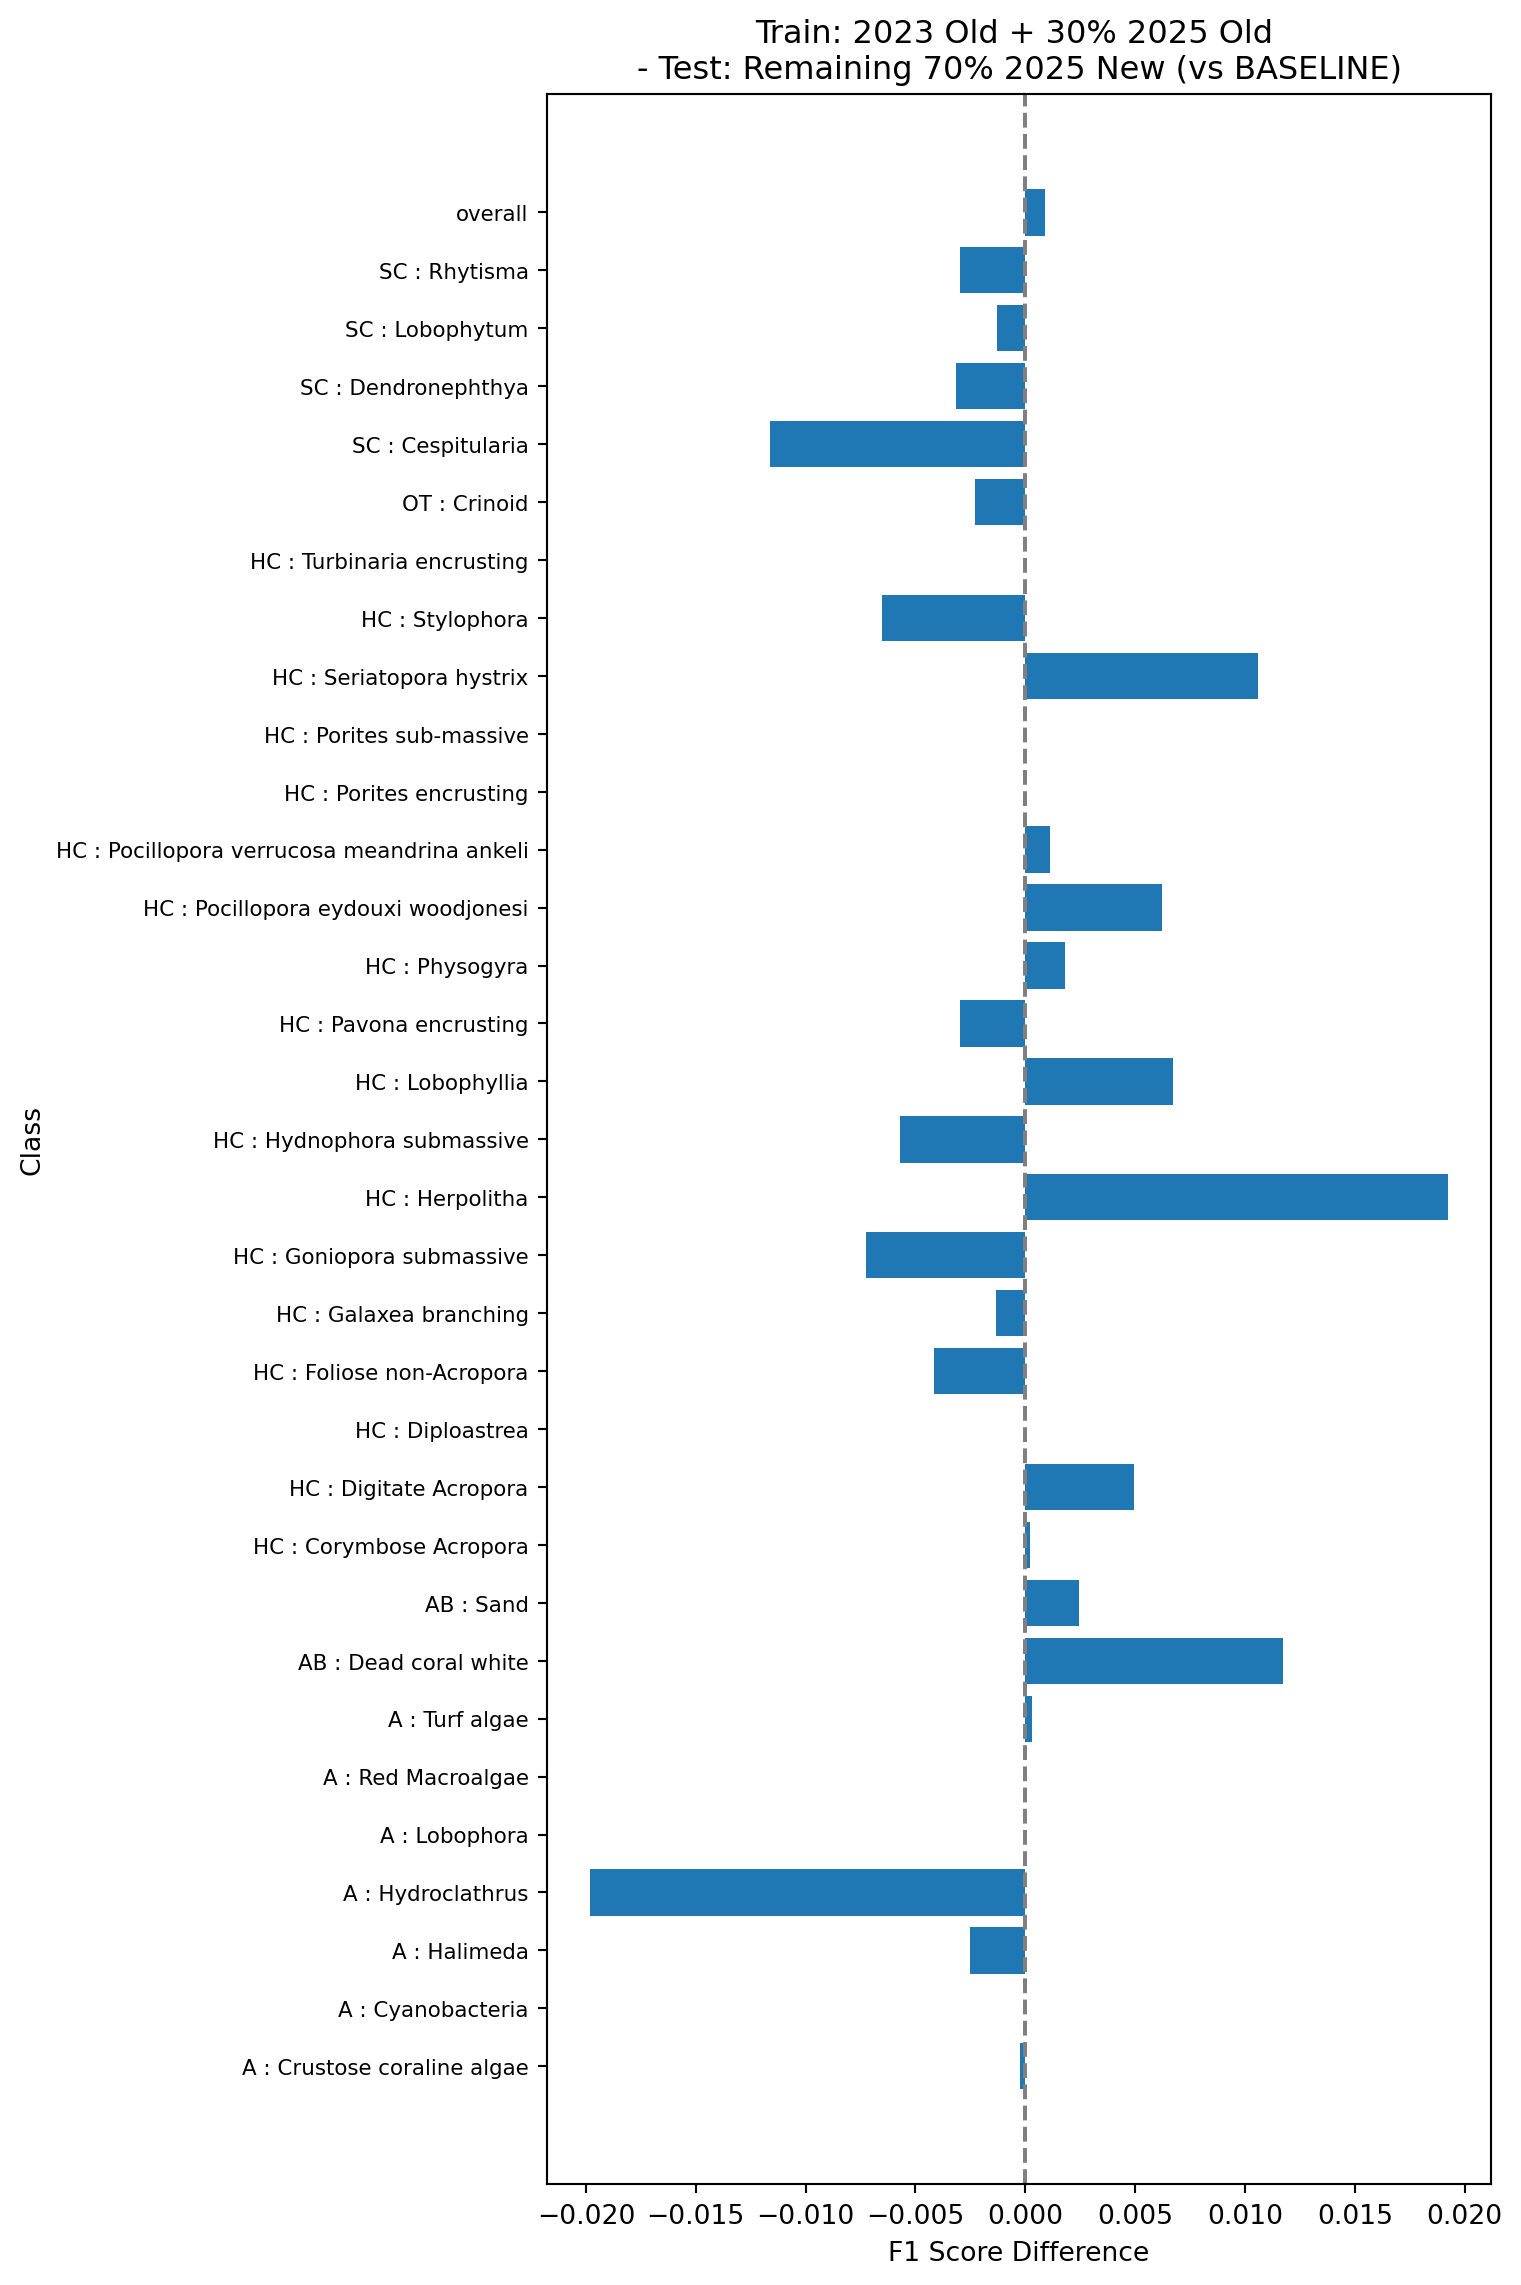
Next we’ll look at the performance of the same model as in Figure 7 but tested on the new vectors (model 3b in Table 1). This demonstrates how an existing model would perform on new data (without training on the new data)

Finally, we’ll look at the performance of a model trained on the 2023 data using the old vectors, and 30% of the 2025 data but using the new vectors, and tested on the remaining 70% of the 2025 data using the new vectors (model 3c in Table 1). This simulates what would happen if we rolled out the new pipeline and re-trained using a combination of the existing data and the new data.

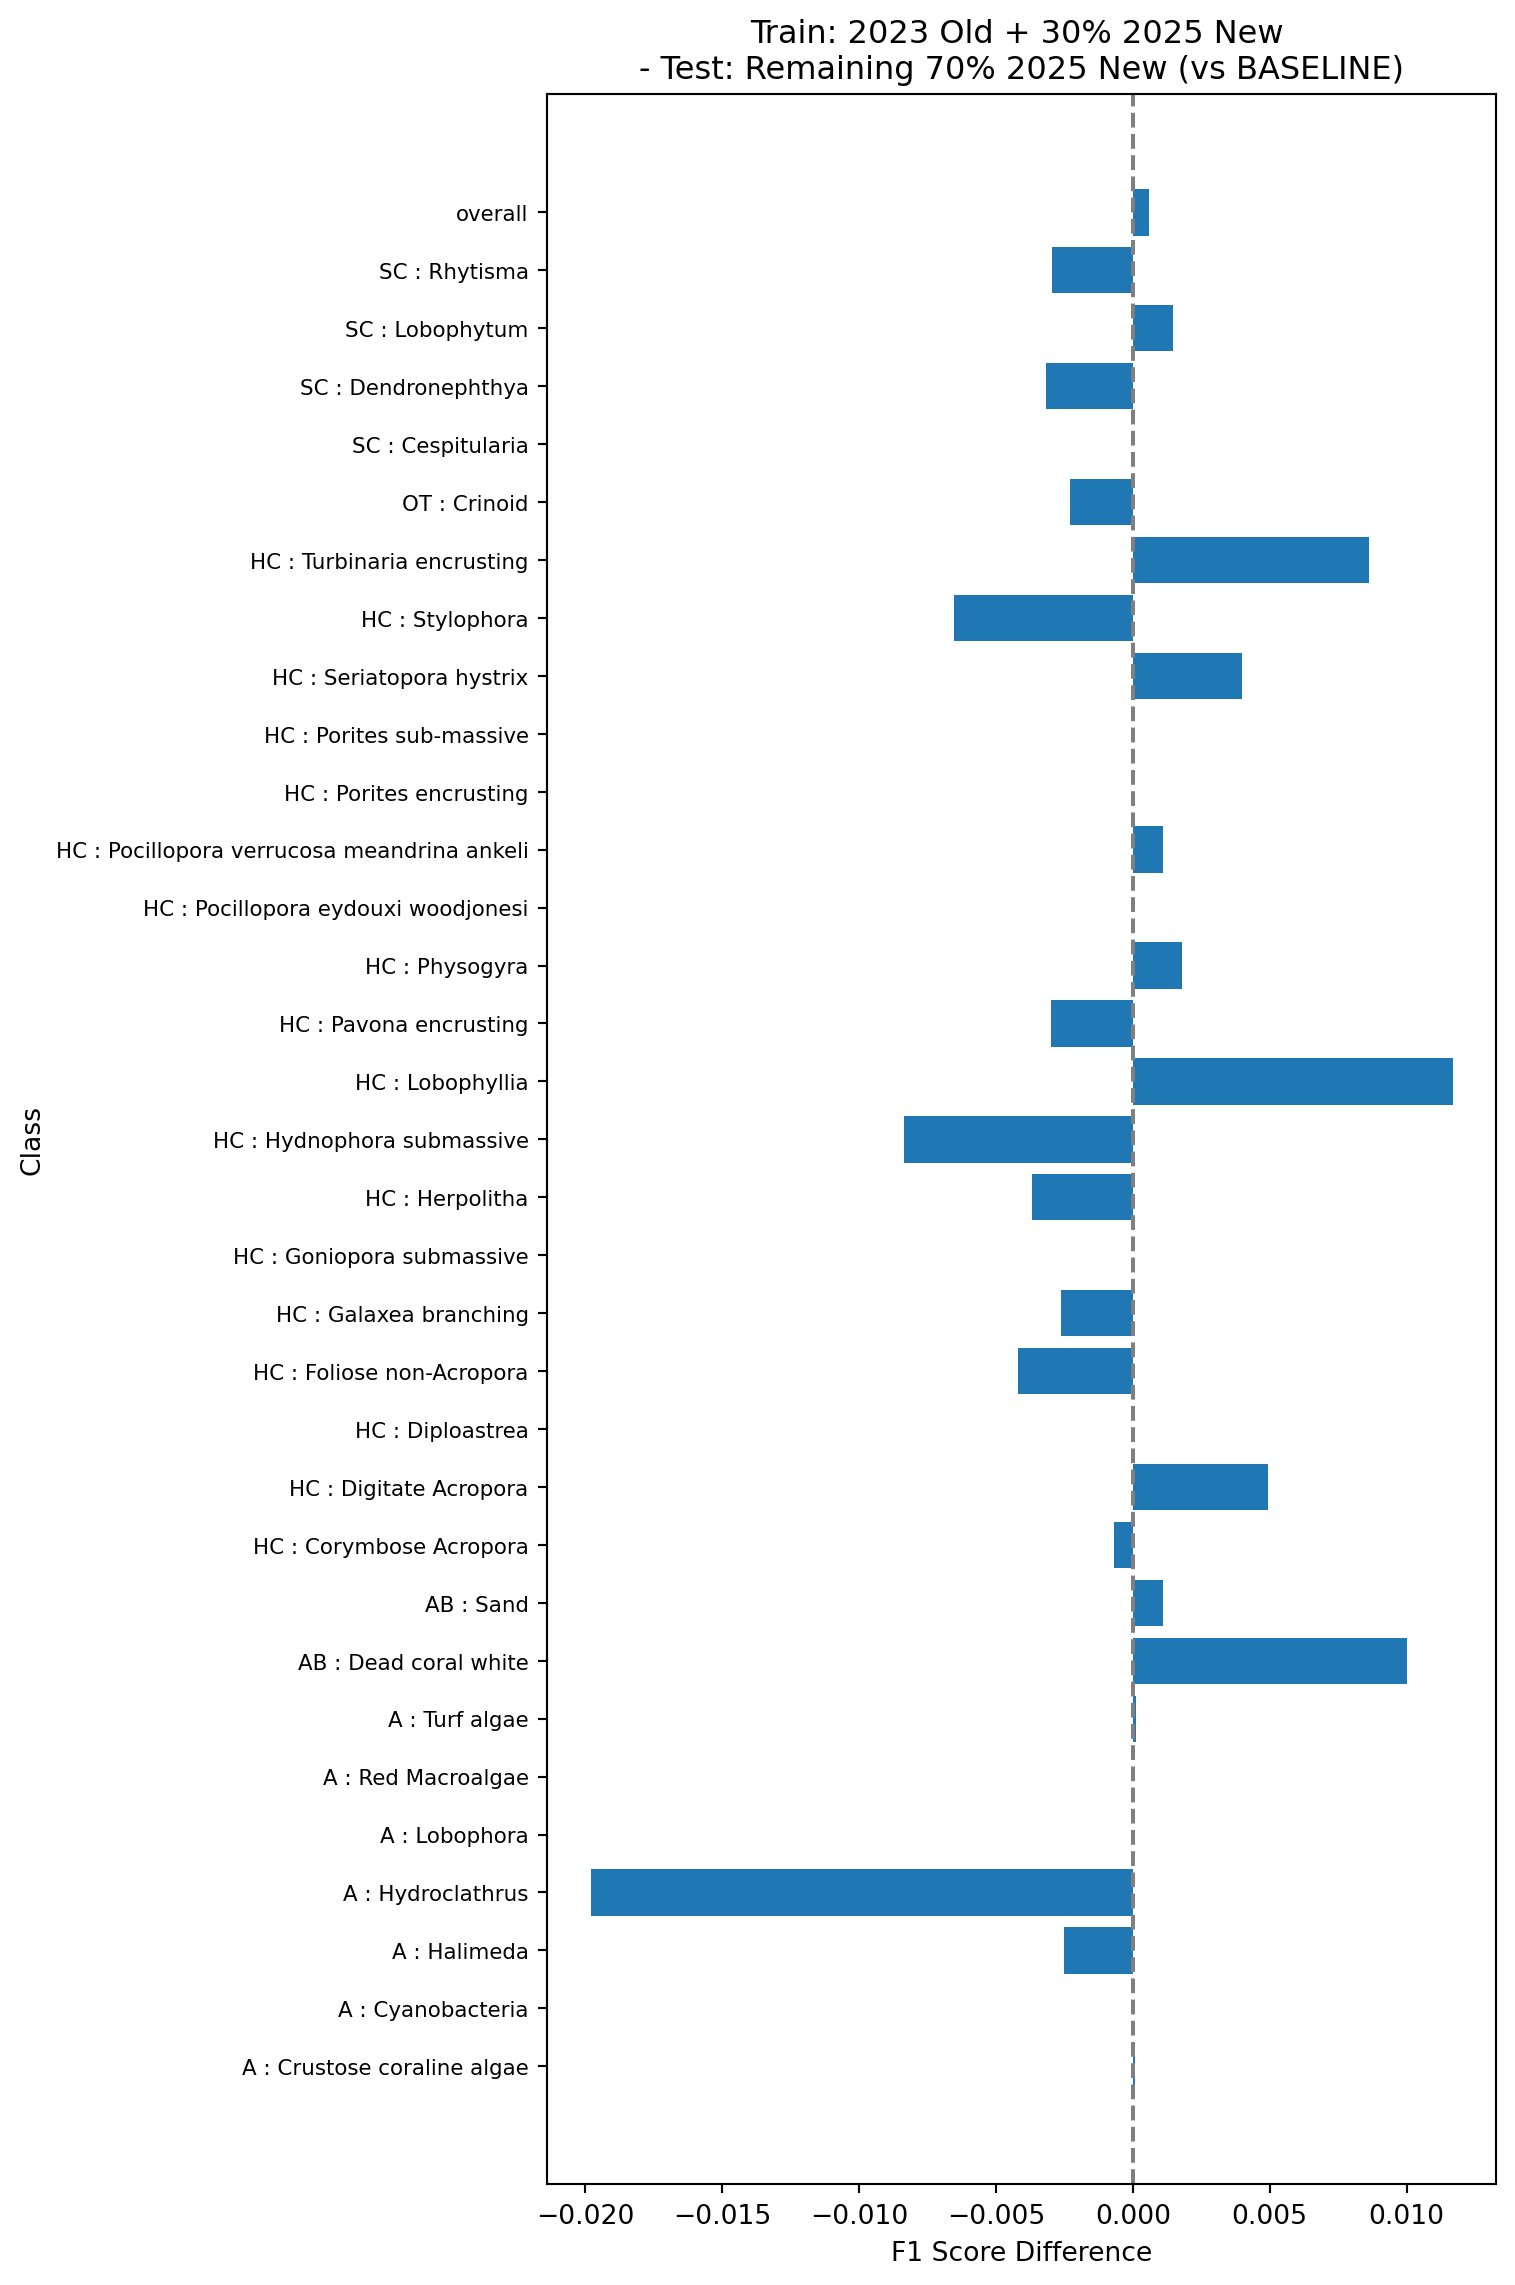
All the tests show very small changes in overall F1 scores (~0.001) when comparing the models trained and tested on the new vectors against the baseline models trained and tested on the old vectors. Changes in classwise F1 scores are also relatively small, with the majority of classes showing changes of less than 0.01, and the largest errors around 0.03. This suggests that the changes in the feature vector extraction pipeline do no result in major changes in the performance of the trained models and can be safely rolled out.
The tests in experiment 3 also show that the performance of models trained using existing data from the old pipeline combined with new data from the new pipeline is very similar to that of models trained on data from the old pipeline alone, which suggests that existing multi-year projects can safely transition to the new pipeline without needing to retrain and re-inference on on all existing points.
In short, users should not face any major changes to their own pipeline after this update. Assessments of F1 scores show little change and will likely not impact any current projects or comparisons to future projects, without any additional need for re-annotating existing projects.